Do you ever feel like you are wasting your customer acquisition budget? That’s what happens when you ignore key customer acquisition metrics.
Without proper measurement, businesses risk wasting budgets on ineffective strategies and fail to ensure sustainable growth.
That’s why it is important to analyze customer acquisition metrics. Which will allow companies to optimize marketing spend, improve customer retention, and maximize ROI.
Measuring acquisition metrics will help businesses understand which channels will drive conversions and which strategies retain customers. Knowing these information businesses will be able to optimize their strategy even better.
So, if you are interested to know, this article will cover essential acquisition metrics—what they are, how to calculate them, and ways to optimize them.
Whether you’re a marketer or business owner, this guide will help refine your strategy. Keep on reading!
What Are Customer Acquisition Metrics?
A customer acquisition metric is assessment data to know how effectively and efficiently a company’s sales and marketing strategies drive growth.
This metric not only measures new customer volume but also their direct contribution to revenue and profit.
Customer acquisition metrics help businesses to:
- Assess whether current marketing strategies deliver measurable results.
- Determine if marketing efforts generate maximum ROI.
- Evaluate whether acquisition costs are efficient.
- Identify the most effective acquisition channels.
- Ensure acquisition strategies align with business goals.
- Guide management in developing future acquisition and marketing strategies.
Why Are Customer Acquisition Metrics Important for B2C Companies?
Customer acquisition metrics are not just about increasing ROI and marketing strategies. They also play a crucial role in helping B2C companies optimize their spending, identify the best channels, and improve retention. Let’s explore these key functions in more detail.
Allocating Budgets Effectively
Metrics like CAC and ROAS help businesses allocate marketing budgets efficiently. Analyzing these metrics, businesses can identify which channels are generating the most revenue and can strategically invest their resources for optimal growth.
An optimal channel should be at 4:1 ROAS, meaning every $1 spent should be returned $4. Tracking these metrics ensures your campaigns stay on track to meet revenue targets and provides better financial control.
One great example is BYLT. BYLT Basics is a fashion and apparel brand, launched its mobile app in April 2023 after selling primarily on marketplaces.
Through social media ads, email marketing, and SMS campaigns, BYLT promoted the app and generated $1.4 million in sales within six months.
They also achieved a 42% ROAS and a 35% increase in CLV.
Identifying High-Performing Marketing Channels
Selecting the right channels is a crucial key. Metrics like Conversion Rate and CPL measure channel effectiveness.
Identifying underperforming channels help businesses to focus on high ROI strategies and reduce costs.
Retaining Customers and Improving Lifetime Value
Tracking subscription or cancellation rate and customer lifetime value (CLV) is essential for measuring customer loyalty and long-term revenue.
Also read: Interstitial Ads vs Rewarded Video Which Ad Format is Right For You?
Analyzing these metrics allows businesses to develop effective retention strategies, optimize loyalty programs, and drive sustainable growth and profitability.
The 12 Most Important Customer Acquisition Metrics
1. Customer Acquisition Cost (CAC)
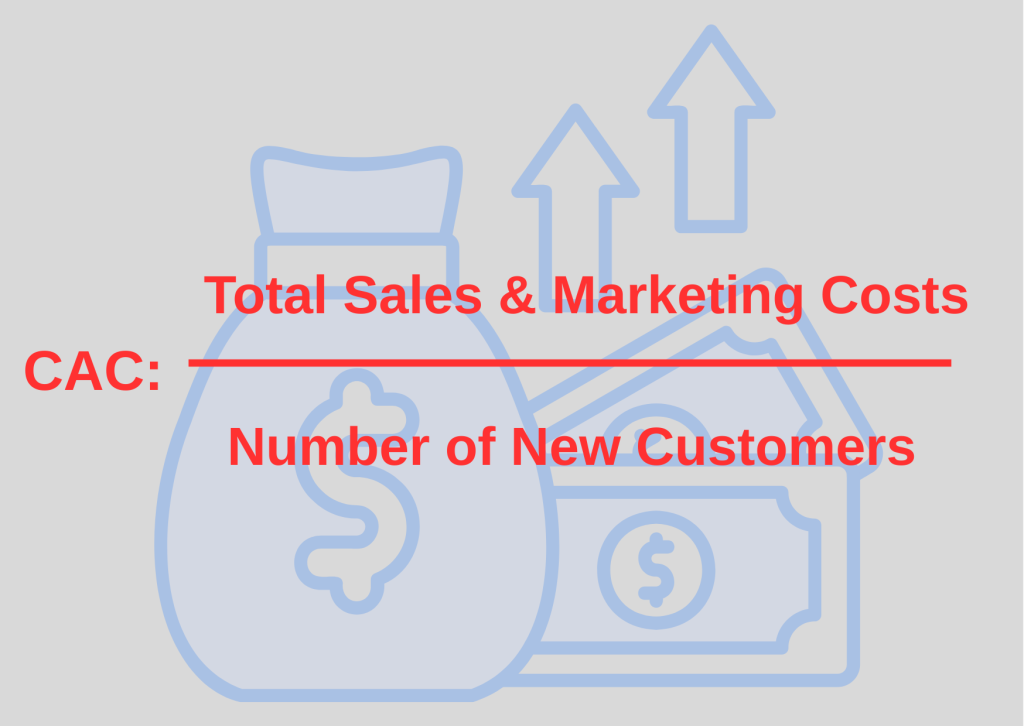
Customer Acquisition Cost (CAC) is the total cost a company spends to acquire a new customer or convert potential buyers into paying customers. Tracking CAC helps businesses to know whether:
- Is the acquisition strategy effective?
- Are marketing expenses efficient and within budget?
- How scalable is the company’s market expansion?
The formula for CAC is:
To keep CAC efficient while maximizing customer reach, follow these steps:
- Combine paid and organic marketing (For Example: Google Ads and SEO, or content marketing and influencer marketing).
- Optimize landing pages & user experience to boost conversions.
- Use referral programs to let existing customers bring in new ones.
- Retargeting to reach high-intent audiences.
- Prioritize high ROI acquisition channels to maximize returns.
2. Customer Lifetime Value (CLTV)
Customer Lifetime Value (CLTV) tracks the total revenue businesses can expect from each customer.
Factors like: strong customer loyalty, repeat purchases, and long-term relationships all contribute to a higher CLTV.
Increasing this metric allows businesses to reduce their dependence on costly customer acquisition efforts and focus on sustainable, long-term growth. The basic CLTV formula is:
CLTV = Average Purchase Value × Purchase Frequency × Customer Lifetime
- Average Purchase Value (APV): Calculates the average amount of money spent per transaction, providing insights into customer spending behavior.
- Purchase Frequency: Measures the number of transactions within a specific period, revealing how often customers interact with your business.
- Customer Lifetime: Tracks the average time a customer continues to make a purchase/subscription from your business before stopping, indicating customer loyalty and long-term value.
For example: Fashionista is a fashion brand that launched its e-commerce app targeting young adult women aged 20 to 35, by offering trendy fashion items.
After a set period, management analyzed critical acquisition metrics:
- Customer Acquisition Cost (CAC): $300
- Average Purchase Value (APV): $50
- Purchase Frequency: 4 times per year
- Customer Lifetime: 3 years
Using the CLTV formula:
CLTV = APV × Purchase Frequency × Customer Lifetime
CLTV = 50 × 4 × 3 = $600
Seeing these results, it means that each customer makes an average of four transactions and generates $600 in revenue for over three years. However, with a CAC of $300, the CLTV-to-CAC ratio is 1:2 which is still below the ideal 1:4 standard.
Fashionista can maximize the CLTV by following these steps:
- Enhance customer experience by providing seamless navigation, fast checkout, and personalized recommendations.
- Implement loyalty programs
- Leverage email & SMS marketing to engage customers with personalized offers and product updates.
- Upsell & cross-sell by suggesting complementary products to increase order value.
- Improved customer support with fast, responsive service.
3. Conversion Rate
Conversion rates help businesses understand how effectively their website or marketing strategies are turning visitors into customers or users.
It measures the percentage of visitors who complete their actual intent. For example, making a purchase or signing up for a service.
The higher conversion rate means better audience targeting, strong user engagement, and increased revenue without extra acquisition costs.
We can also measure the conversion rate with this formula:
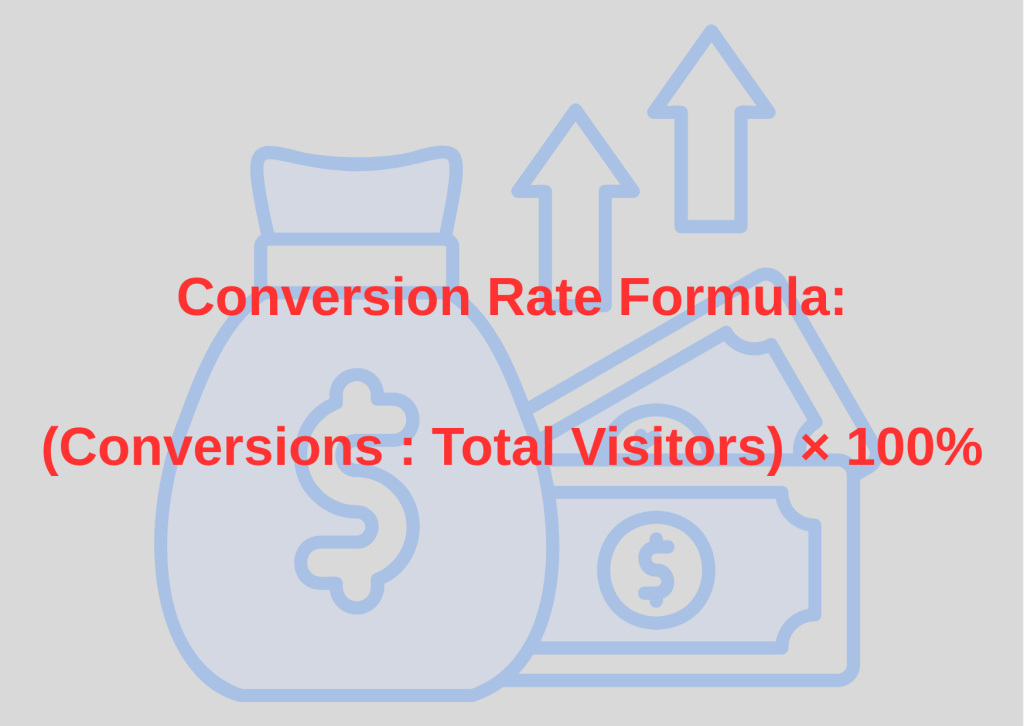
For example: I-Cam, a technology company specializing in IoT-based CCTV, had 10,000 website visitors, with 500 completing a purchase.
The conversion rate will be:
Conversion Rate = (Conversions : Total Visitors) × 100%
= (500/10,000)×100%
= 0,005 x100%
= 5%
Here are some of the measures you can do, to optimize the conversion rate:
- Optimize Landing Pages: Improve your landing page by ensuring fast loading speed, clear CTAs, and a mobile-friendly design.
- A/B Test: Experiment with different headlines, layouts, and CTA placements to find what works best.
- Enhance User Experience (UX): Simplifying navigation, improving checkout processes, and reducing form fields.
- Use social proof: Displays testimonials, reviews, and trust badges to increase credibility.
- Implement Retargeting: Re-engage visitors who didn’t convert with personalized ads and offers.
4. Click-Through Rate (CTR)
Click Through Rate measures how effectively an ad engages with its audience. The higher CTR scores indicates that the ad is well received by users and drives clicks. CTR helps businesses evaluate:
- Keyword performance (Are the selected keywords attracting the right audience?)
- Ad effectiveness (Do advertisements, email campaigns, and website content generate engagement?)
- Social media campaigns (How well do marketing efforts drive interaction?)
We can measure the CTR level with the following formula:
CTR = (Total clicks / Total impressions) x 100%
For example: Home4All, real-estate developer, launched ads on several websites. The ad was viewed 1,000 times and received 50 clicks. So the CTR is:
CTR = (50 / 1,000) x 100%
CTR = 5%
Improve CTR by applying these strategies:
- Write attention-grabbing headlines and engaging ad copy. Include 1–2 relevant keywords to improve visibility and attract the right audience.
- Encourage users to take action with clear, persuasive CTAs like “Shop Now,” “Learn More,” or “Get Your Free Trial.”
- Use high-quality images or videos to make ads more appealing.
- Run A/B testing to compare different visuals and determine what drives the best results.
- Use trending and relevant hashtags to expand reach, boost engagement, and improve discoverability.
For example: Duolingo, a language learning app. Duolingo’s CTR Optimization Strategies are:
- Content marketing: Creating engaging content marketing, like blog content with visually appealing images in its signature green branding.
- UX optimization: They improved their website so that it will be easily used.
- Social media engagement: Duolingo maximized social media presence to drive traffic and conversions.
Results:
- User Growth – Increase to 19 million users by August 2023.
- Lower Churn Rate – From 47% in 2020 to 37% in 2023.
- Higher In-App Transactions – Increase by 30% within the same year.
5. Churn Rate
Churn Rate measures the percentage of customers who stop using a company’s products or services within a specific period. Tracking this metric helps businesses:
- Assess the company’s current business conditions.
- Measure customer satisfaction levels.
- Analyze competitive positioning against rivals.
- Identify key areas for improvement, especially in customer service.
The formula is: (Total lost customer : Total customer at the start of time period) x 100%
For example, Homey, a property management company, found out that over 100 customers stopped using their products during this period.
Meanwhile, the number of customers acquired at the beginning of the period was 1,000. That’s make the churn rate to be:
Churn Rate = (Total lost customer : Total customer at the start of time period) x 100%
= (100 : 1.000) x 100%
= 10%
A high churn rate indicates there are retention issues and potential revenue loss. On the other hand, lowering churn helps maximize ROI and long-term growth. Some of the following tips can help:
- Segment customers & analyze data by delivering targeted ads for better engagement.
- Create informative content & ads to ensure customers understand product value.
- Enhance user experience
- Increase customer engagement by sending personalized offers via email, SMS, or in-app messages.
- Strengthen customer support.
6. Average Order Value (AOV)
AOV (Average Order Value) calculates the average amount customers spend per transaction. The formula is: AOV = Total Revenue / Number of Orders
Tracking AOV matters because it helps businesses to:
- Analyze customer behavior: Track purchasing patterns to understand preferences, trends, and factors influencing buying decisions.
- Identify service improvement areas: Evaluate customer feedback and pain points to maximize user experience and satisfaction.
- Develop strategies to increase transactions: Implement upselling, cross-selling, and personalized offers to boost average order value.
These following tips will help you to increase the AOV value:
- Encourage customers to spend more by offering higher-priced alternatives (upselling) or complementary products (cross-selling).
- Increase order value by providing special discounts for bulk purchases.
- Offer free shipping or additional discounts on large orders.
- Use customer purchase history and browsing behavior to suggest relevant products.
7. Referral Source
Referral sources show where new customers come from and how they discover your business. Common sources include friend recommendations, word-of-mouth, and links from other websites.
Tracking referral sources is crucial for improving website visibility, SEO rankings, and increasing conversion rates.
Businesses can use existing customers to attract new users by offering incentives for both. Track the referral sources using some tools, such as Google Analytics 4. These are the steps.
- Log in to Google Analytics 4.
- Go to Reports, then click Acquisition
- Click Navigation Acquisition.
- Scroll down to the Referral row to view traffic data and user engagement.
- Use the search bar and type ‘referral’ to filter sources.
- Click the blue plus sign, then select Referral Source.
- Click Session Source to analyze the following key metrics:
- Percentage of new visitors: Understand how many users come from referrals.
- Average time spent on site: Identify user engagement levels.
- Bounce rate: Insight on how many users leave quickly without interaction.
- Top referral sources: Help to determine which platforms drive the most traffic.
Referral analysis helps businesses optimize high-performing platforms to attract more visitors.
The measurement is important to help improve website experience and acquisition strategies based on referral insights.
8. Return on Advertising Spend (ROAS)
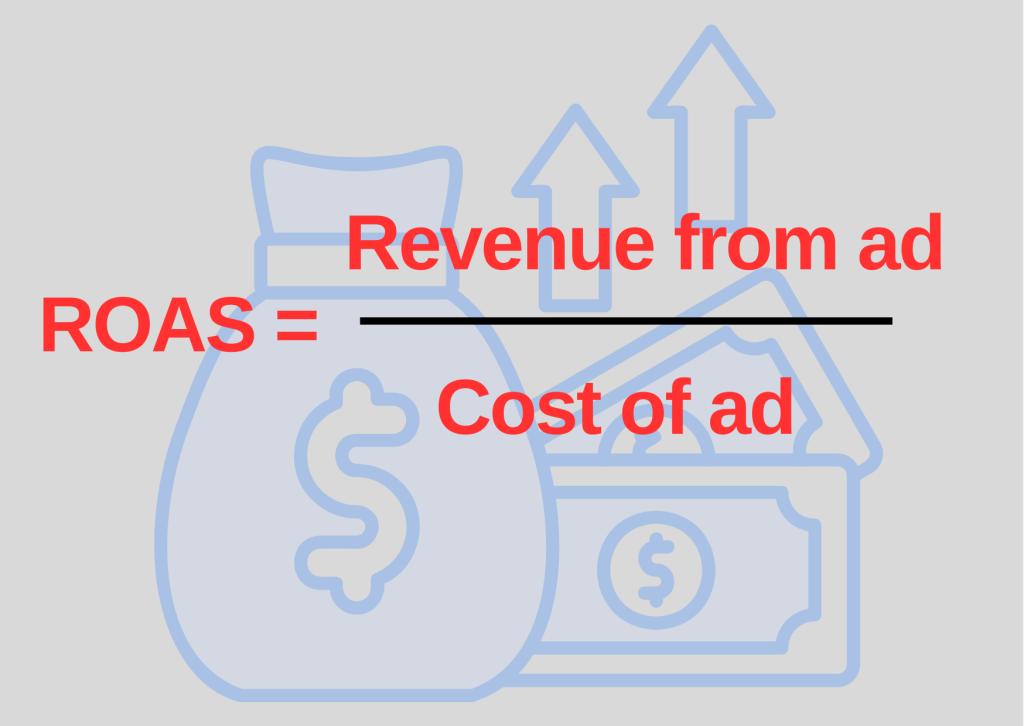
Return on Ad Spend (ROAS) measures how effectively a company’s advertising campaign generates revenue. It compares total ad revenue to total ad costs using the following formula:
A higher ROAS indicates a more effective marketing campaign. Tracking ROAS helps businesses evaluate:
- Top-performing ad & platforms by identifying which ad types and platforms generate the most revenue.
- Ad budget allocation. Optimize spending by diversifying across multiple platforms.
- Ad efficiency by determining whether the current ad spend is delivering maximum returns.
Example: Student’s Room, an AI-based learning app, calculates its customer acquisition metrics after one period. The data shows:
- Total ad revenue: $350,000
- Total ad cost: $100,000
Thus, the ROAS calculation is:
ROAS = 350,000 ÷ 100,000 = 3.5
This means that for every $1 spent on ads, Student’s Room generates $3.50 in revenue, indicating a strong return on ad investment.
Analyzing and optimizing ROAS, is important for businesses looking to optimize their advertising strategies, enhance profitability, and improve overall marketing efficiency.
9. Marketing Percentage of CAC
The marketing percentage of CAC measures the proportion of marketing costs within the total customer acquisition cost (CAC). Calculate this metric using the following formula:
M%CAC = (Total Marketing cost : Total Sales and Marketing Cost ) x 100%
The metric helps businesses to:
- Track the marketing budget and understand how much of the budget goes into marketing.
- Evaluate marketing effectiveness by measuring the performance of marketing strategies.
- Optimize marketing budget allocation more efficiently.
- Assess customer acquisition diversity to ensure the company has a balanced and effective acquisition strategy.
- Measure the company’s dependence on marketing to see how much it drives product or service sales.
Lower marketing costs reflect an efficient strategy, helping expand into new markets and attract customers beyond existing ones.
10. Shopping Cart Abandonment Rate
The shopping cart abandonment rate measures the percentage of customers who begin the checkout process but don’t complete their purchase.
A high abandonment rate can significantly impact revenue loss. To reduce the metric, businesses can:
- Evaluate market analysis to understand customer behavior better.
- Improve the shopping experience by offering discounts, free shipping, and other incentives.
- Optimize the payment process
- Send reminder messages to encourage customers to complete their purchase.
Calculate the shopping cart abandonment rate using this formula:
Shopping Cart Abandoned Rates = (Completed Purchase : Shopping Cart Created) x 100%
Formula explanation:
- A complete purchase is a successful transaction from checkout to payment.
- Shopping cart created refers to products added but not purchased.
11. Order Frequency
This metric shows how often a product is ordered by customers. The formula is:
Order Frequency = Number of Order : Number of Customer
Order frequency helps you track repeat customers and their transaction frequency within a set period. It reveals:
- Customer loyalty to your products and services.
- Planning needs to avoid product shortages.
- Marketing campaign effectiveness for repeat customers.
- Relevant between marketing strategies and customer preferences.
A high order frequency rate is key to maintaining revenue and improving customer retention. To optimize this, try:
- Maintaining product/service quality.
- Offering loyalty programs for repeat customers.
- Rewarding second and subsequent purchases.
- Engaging customers regularly via emails or messages.
12. Loyalty Rate
The Loyalty Rate measures how well a business retains customers over the long term. It’s a key indicator for customer retention and brand loyalty.
A high loyalty rate leads to:
- Reduced churn rate.
- Increased repeat purchases.
- Higher customer lifetime value.
Here is the formula for Loyalty Rate:
Loyalty Rate = (Number of Loyal Customers / Total Customers) x 100%
To foster loyalty, offer rewards for repeat purchases, exclusive promotions for loyal customers, and personalized messages to engage them.
Common Mistakes to Avoid When Tracking Customer Acquisition Metrics
Tracking metrics can be tricky if you’re not careful. Some common pitfalls include:
- Focusing on vanity metrics (like social media likes) that don’t reflect business performance.
- Ignoring data quality (which can lead to inaccurate conclusions).
- Misinterpreting trends (which might cause misguided strategies).
To avoid these mistakes, make sure to prioritize actionable metrics that align with business goals.
Maintain data accuracy by regularly cleaning your data and analyzing trends with context, considering external factors.
Conclusion
Customer acquisition metrics are essential for optimizing your marketing strategies and improving ROI.
Track key metrics like CAC, CLV, and conversion rates to help you make data-driven decisions So you can attract, retain, and engage customers more effectively.
Start monitoring these metrics today to refine your strategies and drive business growth.
Ready to take your customer acquisition strategy to the next level? Explore TyrAds solutions and scale your business growth today.